
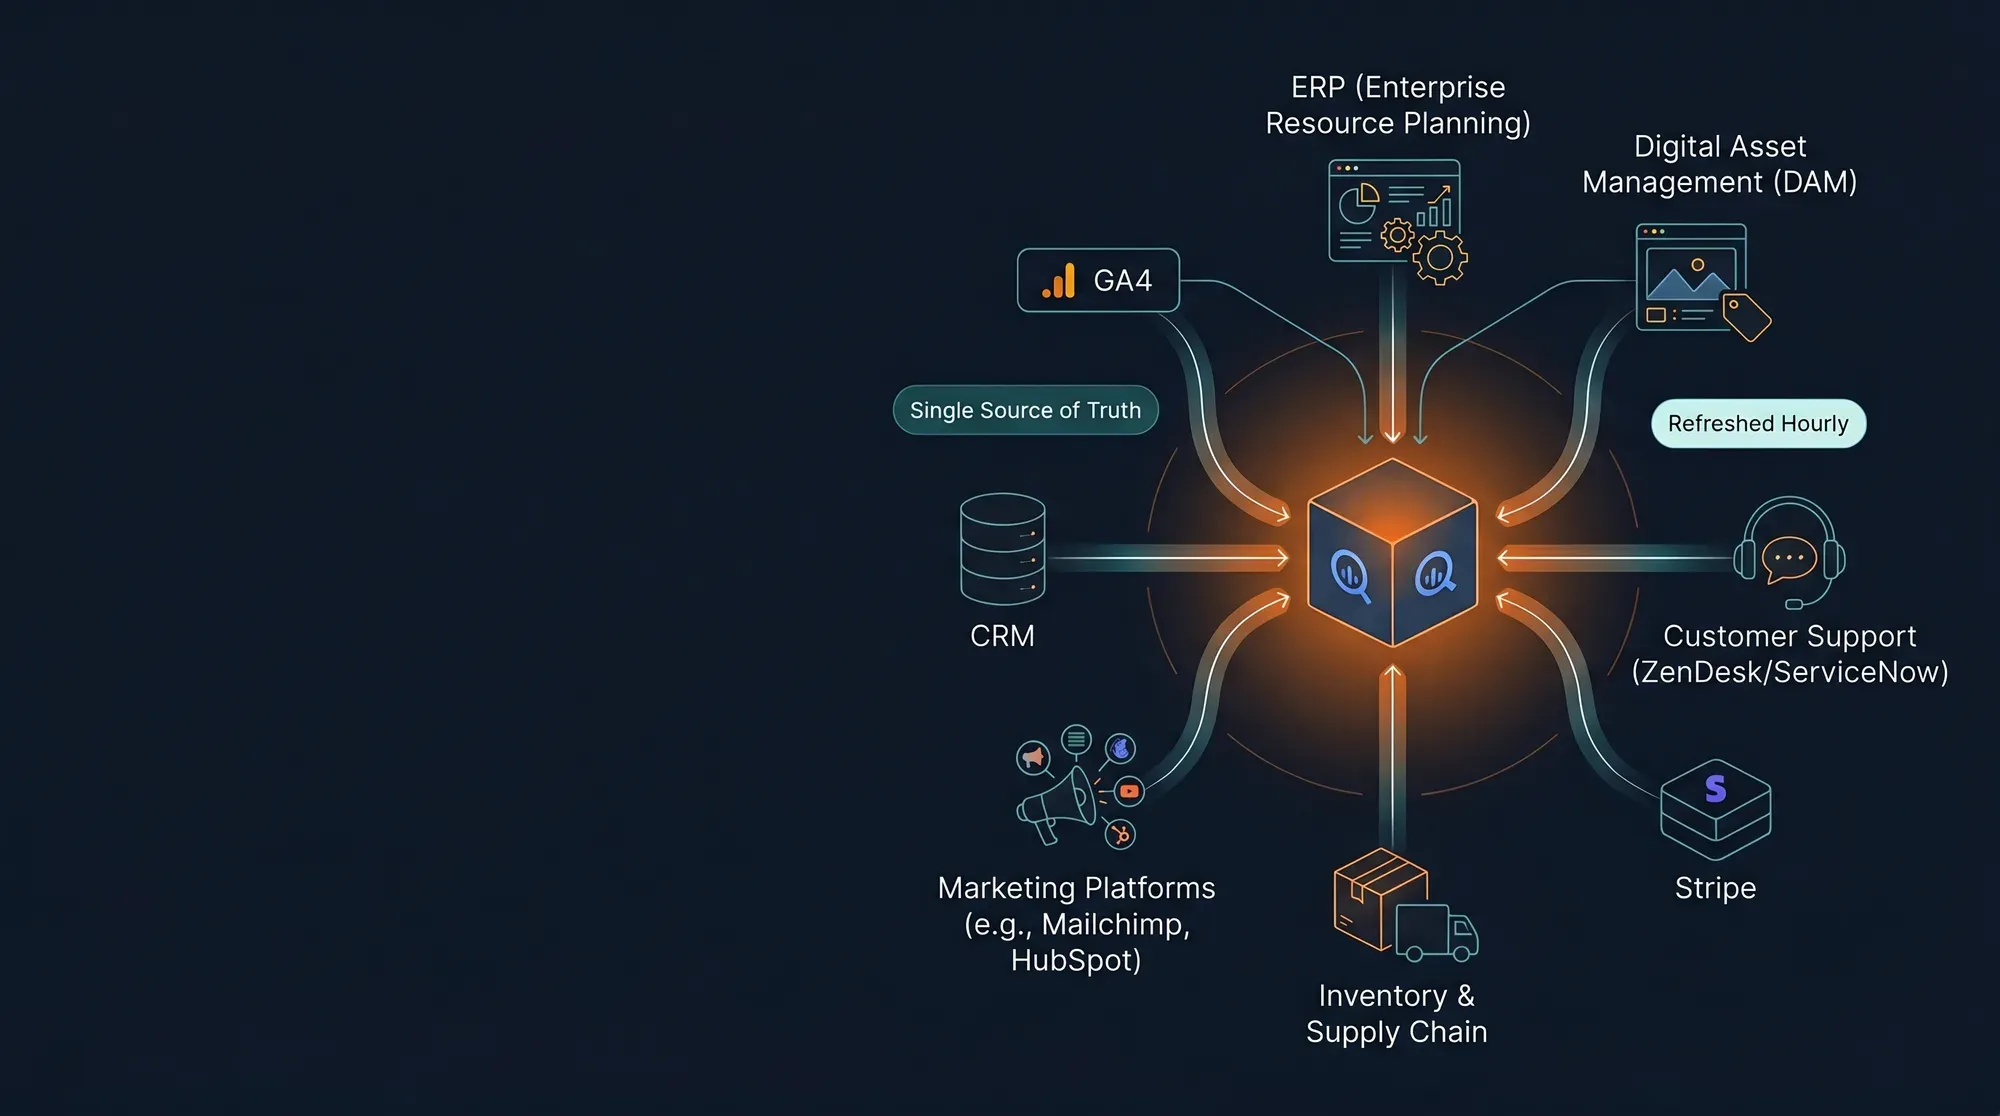
Your Data Is in Ten Places. Your Decisions Are Based on None.
We centralize GA4, your CRM, every ad platform, and your e-commerce stack into a single warehouse — modeled with dbt, governed, and served to dashboards that update themselves. Reporting drops from three days to three seconds.
Fragmented Data Is a Decision Tax.
You can't optimize what you can't measure consistently. Here's what fragmentation is silently costing you right now:
The Spreadsheet Tax
Your team spends 6–12 hours every week pulling exports from GA4, the CRM, ad platforms, and Shopify into a shared Google Sheet. By Monday morning the numbers are already stale — and they don't reconcile between dashboards anyway.
12+ hrs/week of manual reportingConflicting Numbers
GA4 reports one revenue figure. Shopify reports another. Meta Ads Manager shows a third. Without a canonical warehouse, every leadership meeting starts with arguing about whose dashboard is right — and ends with no decisions made.
3+ versions of every key metricNo Long-Term Memory
GA4 keeps 14 months of raw data in the UI. Most ad platforms keep less. Without your own archive, you can't run year-over-year comparisons, cohort retention curves, or longitudinal attribution. Every strategy meeting runs on 30-day rolling data.
14 months max in raw UIs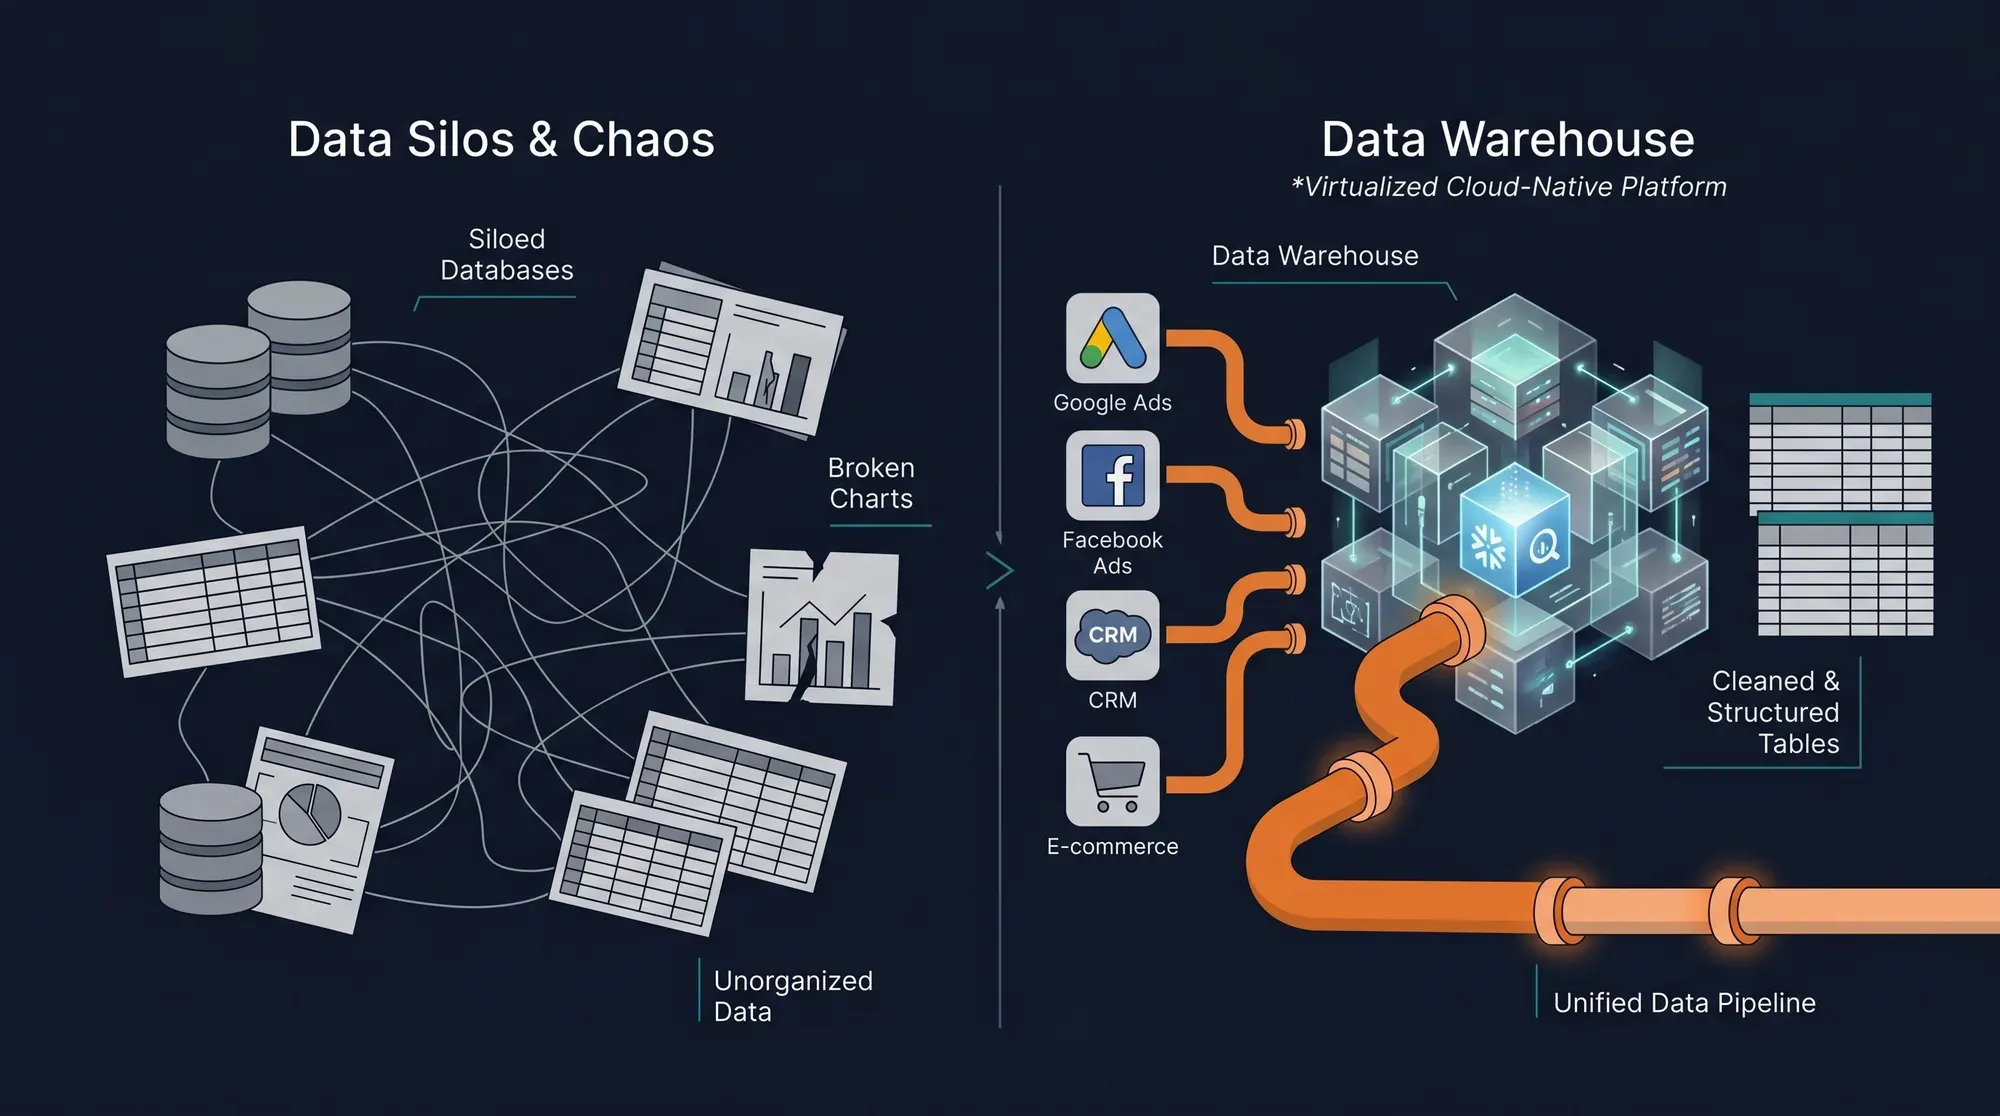
One Warehouse. Four Layers. Zero Spreadsheets.
We don't just dump data into a database. We build the four layers that turn raw events into decisions — each one engineered, tested, and monitored.
Ingestion — Every Source, One Pipe
GA4 lands in BigQuery via Google's native export (free, daily, schema-stable). Salesforce, HubSpot, and Zoho CRM stream through Airbyte connectors. Google Ads, Meta, TikTok, and LinkedIn Ads ride the same fabric. Shopify orders, Stripe payments, and Klaviyo events round out the picture. Every connector is monitored, versioned, and re-runnable — no manual CSV exports, ever.
Impact → 15+ sources unified · zero manual work · backfill on demand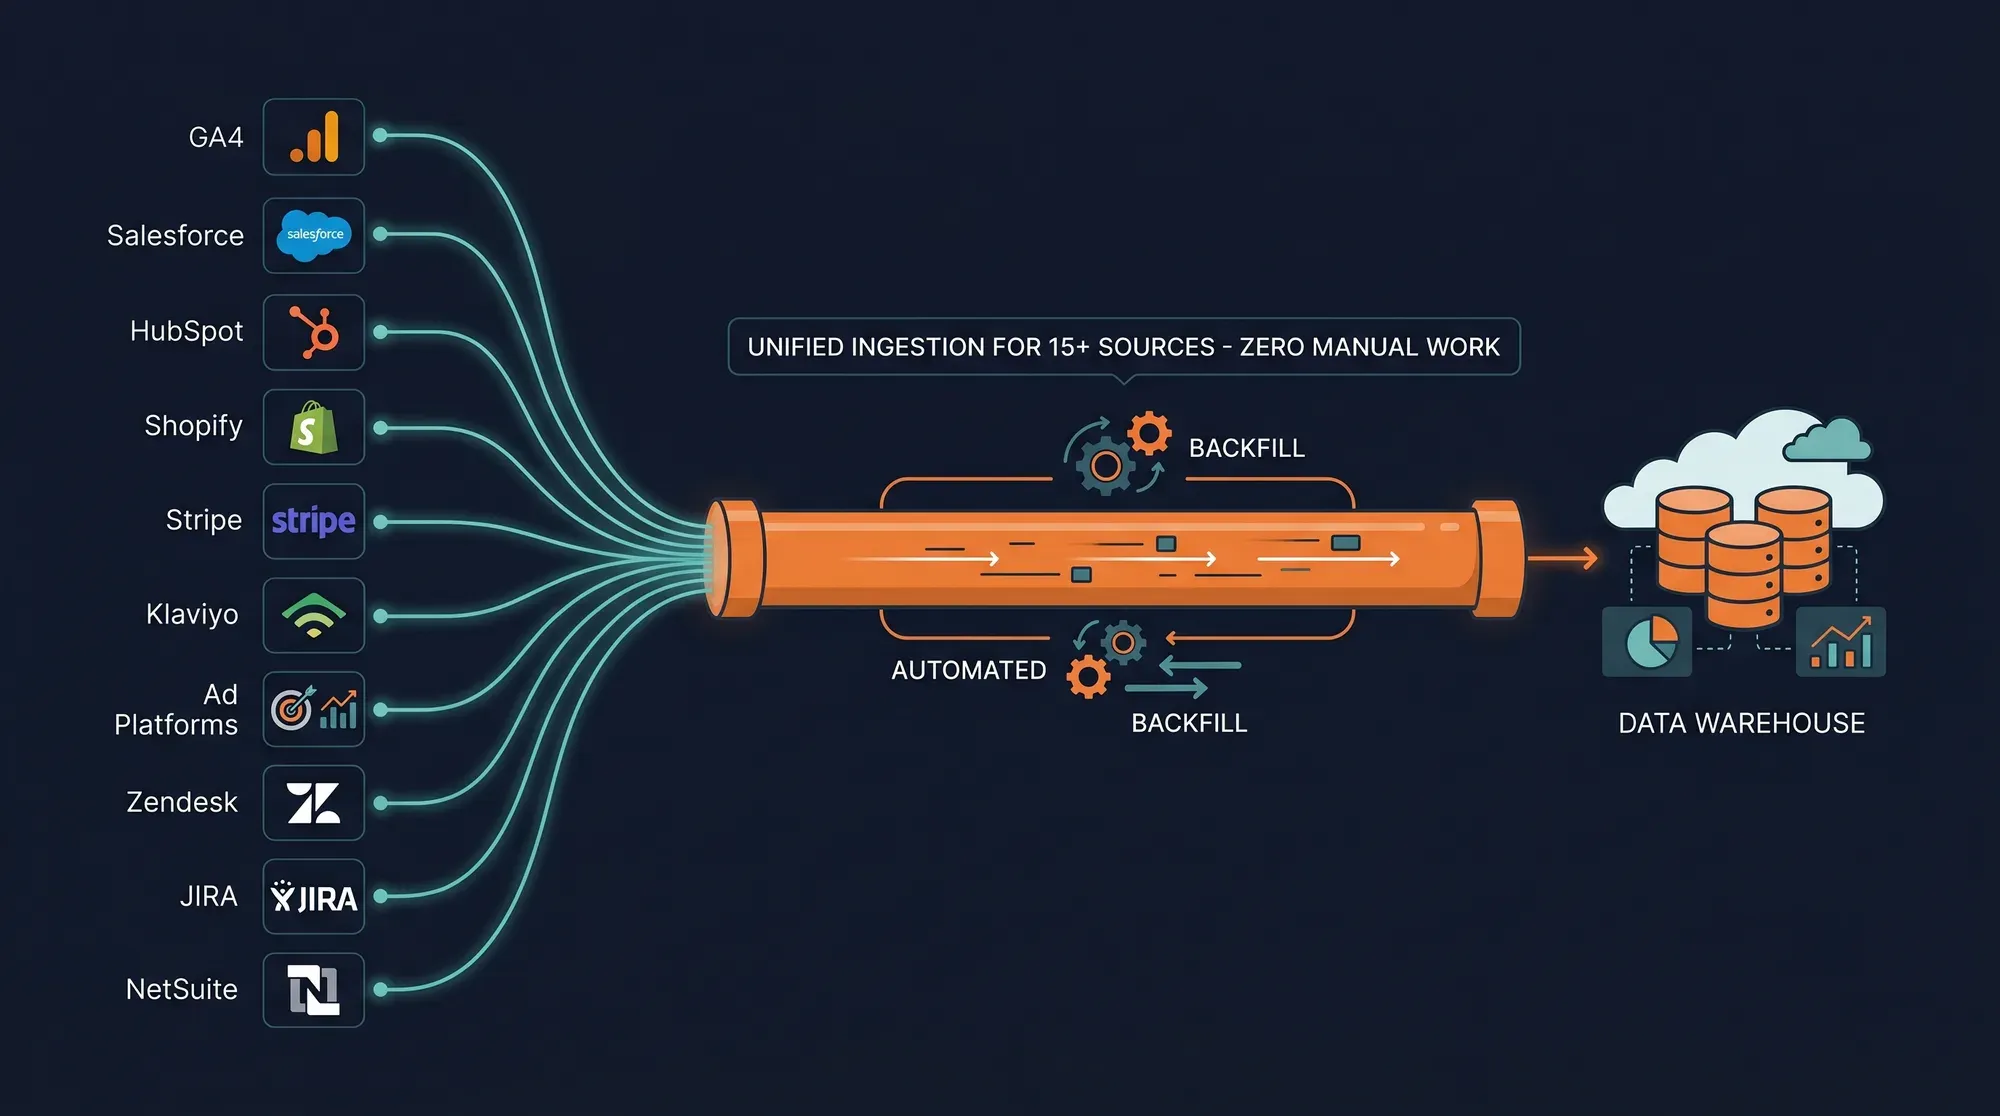
Storage — Warehouse-Native by Default
BigQuery is our default — serverless, columnar, no infrastructure to babysit, with free GA4 export built in. Tables are partitioned by event_date, clustered on user_id, and tuned for the query patterns your dashboards actually run. Cost stays predictable through partition pruning, column selection, and slot reservations on steady workloads. Postgres + Metabase remains an option for sub-100GB volumes or strict data-residency constraints.
Impact → Predictable cost · sub-second queries on marts · multi-year history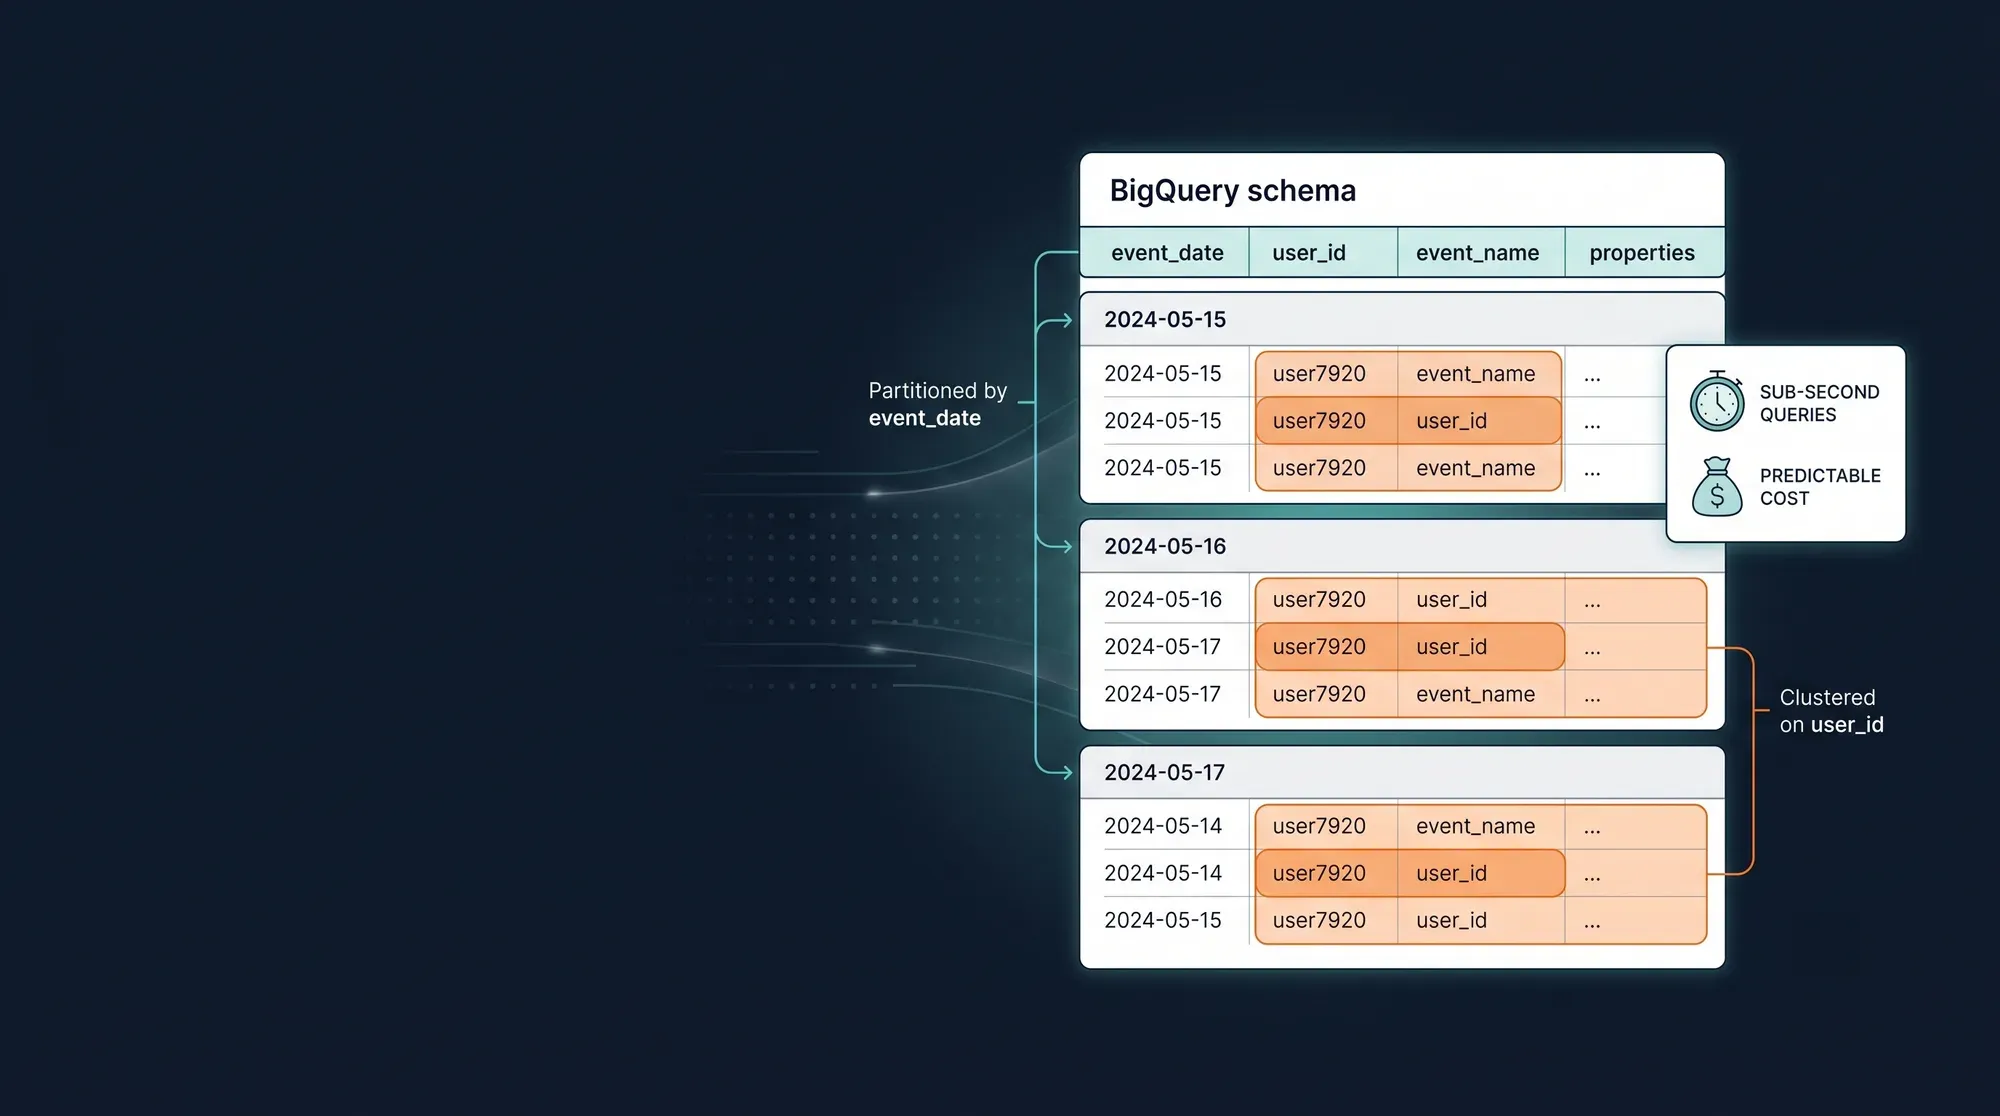
Transformation — dbt: Staging → Intermediate → Marts
Raw stays raw. Staging models clean and type the source data 1:1. Intermediate joins entities (sessions ← events, orders ← line items). Marts are the business-ready layer your team queries: fct_orders, dim_customers, mart_revenue_daily. Every model is versioned in git, tested for nulls / uniqueness / referential integrity, and documented automatically. dbt docs becomes your team's queryable data dictionary.
Impact → Trusted metrics · git-reviewed changes · self-serve documentation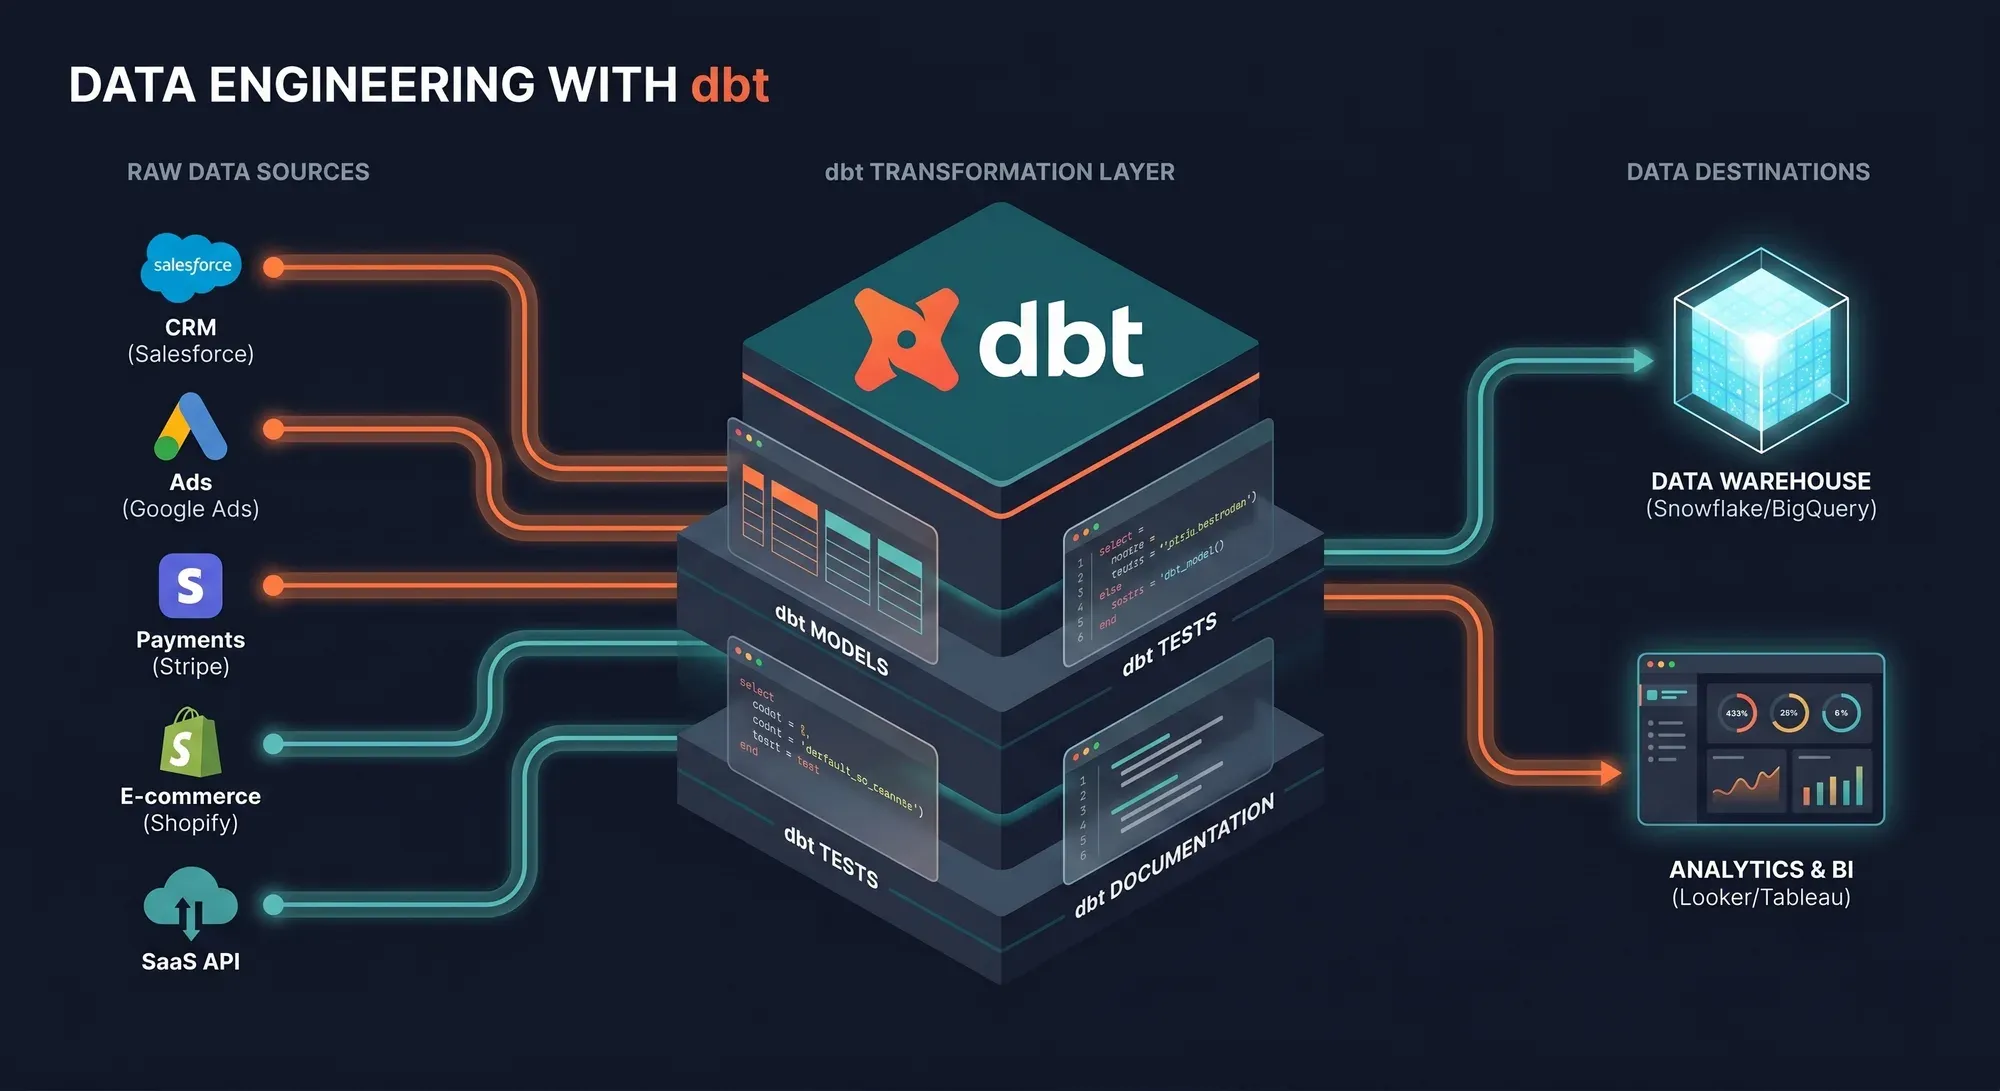
Activation BI — Dashboards on Marts, Not Raw
Power BI, Looker Studio, Metabase, Tableau — they all read from the same dbt marts. The BI tool is a choice independent of the warehouse: most of our clients run Power BI directly on BigQuery, and it works perfectly. What matters is that every dashboard hits a curated, tested mart — not a 50-line ad-hoc query that breaks the moment a schema changes upstream.
Impact → Consistent metrics across tools · no broken dashboards · CFO-grade trust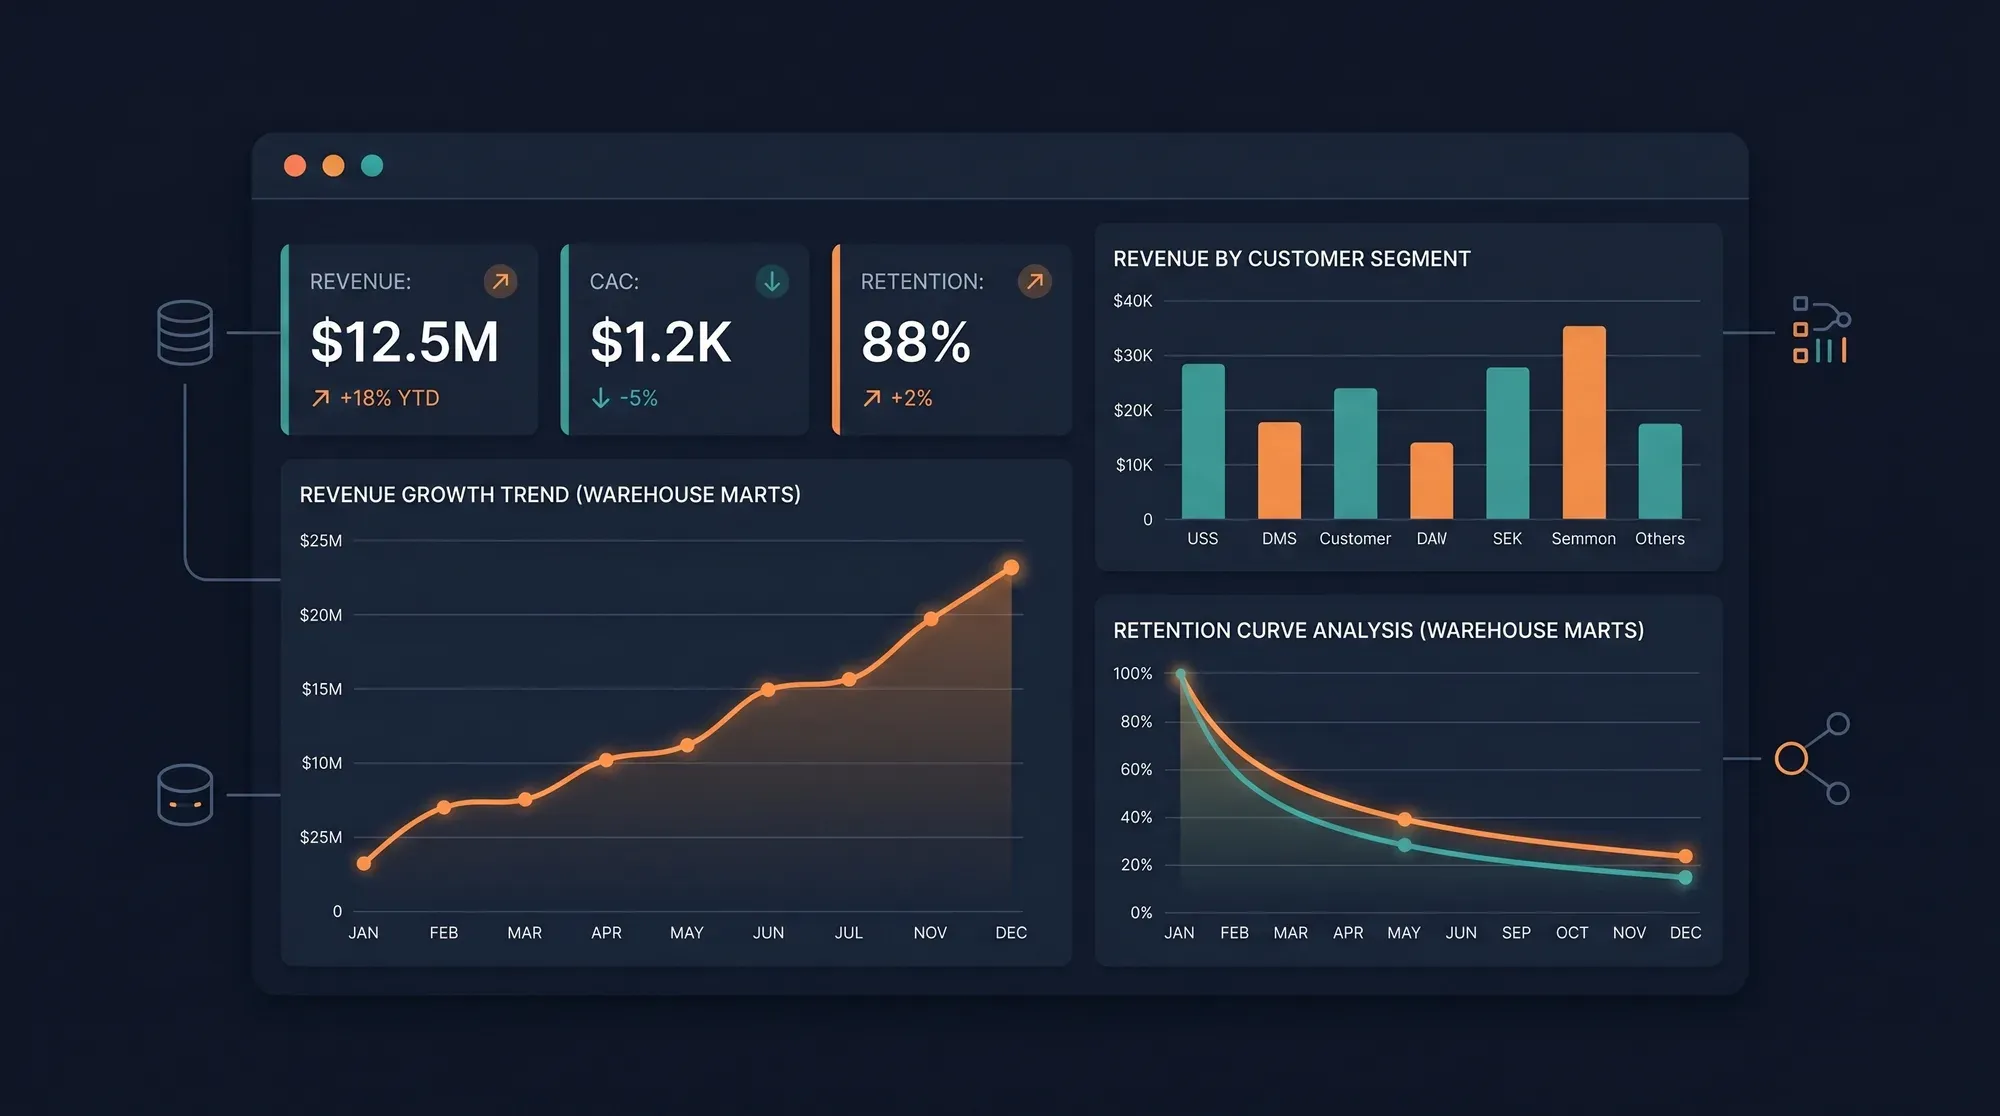
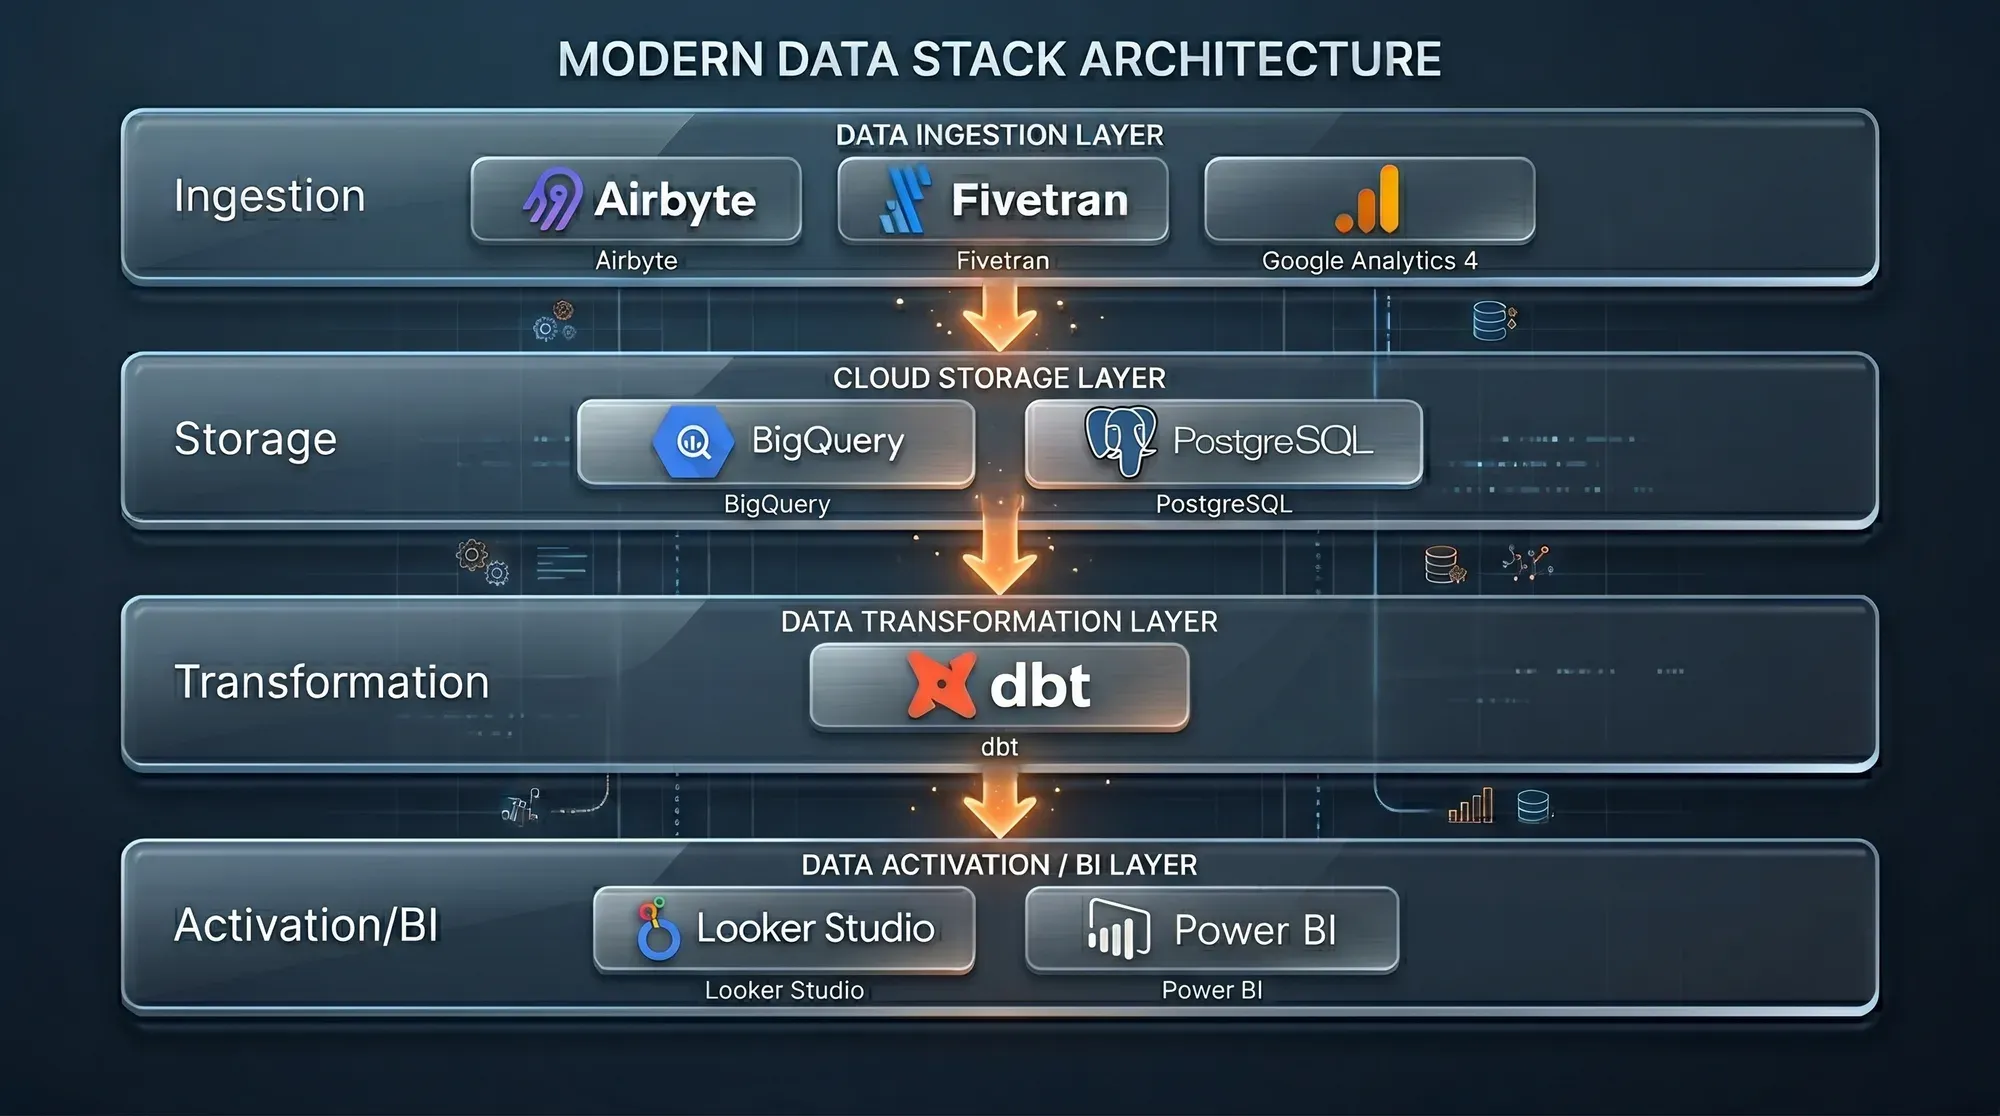
Pick Your Tools Per Layer — They're Independent
We've seen too many decks where the stack is sold as a fixed bundle. It isn't. Ingestion, storage, transformation, and BI are four separate choices — based on your volume, budget, team skill, and existing licensing.
Ingestion
Pull raw data from every source on a schedule, with retries and schema monitoring.
- GA4 → BigQuery exportNative · free · daily
- AirbyteOSS · 350+ connectors
- FivetranManaged · enterprise SLA
- Custom PythonFor niche or proprietary APIs
Storage
The warehouse where everything lands. Choose based on volume, cost model, and existing cloud commitments.
- BigQueryDefault · serverless · pay-per-query
- PostgresSmall volumes · self-hosted
Transformation
Where raw becomes trusted. SQL-based, version-controlled, tested.
- dbt CoreDefault · OSS · git-versioned
- dbt CloudHosted · scheduler · IDE included
- DataformGoogle-native alternative
BI / Activation
How leadership and operators consume the data. Independent of every layer above.
- Power BIWorks on BigQuery — yes, really
- Looker StudioFree · Google-native
- MetabaseOSS · self-hosted
- TableauEnterprise legacy fit
Our Implementation Methodology
A proven 6-step process — from inventory to a production warehouse your team can trust, in 6 to 10 weeks.
Source Audit
3–5 daysWe inventory every tool producing data — GA4, CRM, ad platforms, e-commerce backend, support, email. We document schemas, refresh cadences, ownership, and retention policies. Nothing gets connected until we know what we're connecting.
Target Schema Design
2–3 daysWe design the entity model before writing one line of code: events, sessions, users, orders, campaigns. Grain, primary keys, slowly-changing dimensions, and relationships — all documented in an ERD that survives team turnover.
Ingestion Stand-Up
1–2 weeksGA4 → BigQuery native export wired up. Airbyte connectors deployed for CRM, ads, e-commerce, ESP. Historical backfill where APIs allow. Row counts validated against source systems before any downstream work begins.
dbt Modeling (Staging → Marts)
2–4 weeksStaging models clean and type raw data 1:1 with sources. Intermediate models join entities. Mart models are business-ready: fct_orders, dim_customers, mart_revenue_daily, mart_cohort_retention. Tests on every model — uniqueness, not-null, relationships, accepted values.
BI Dashboards
1–2 weeksPower BI or Looker Studio connected to marts. Executive dashboards built: revenue by channel, CAC payback by source, retention cohorts, RFM segment movement. Each dashboard is documented and trained with the team that will use it.
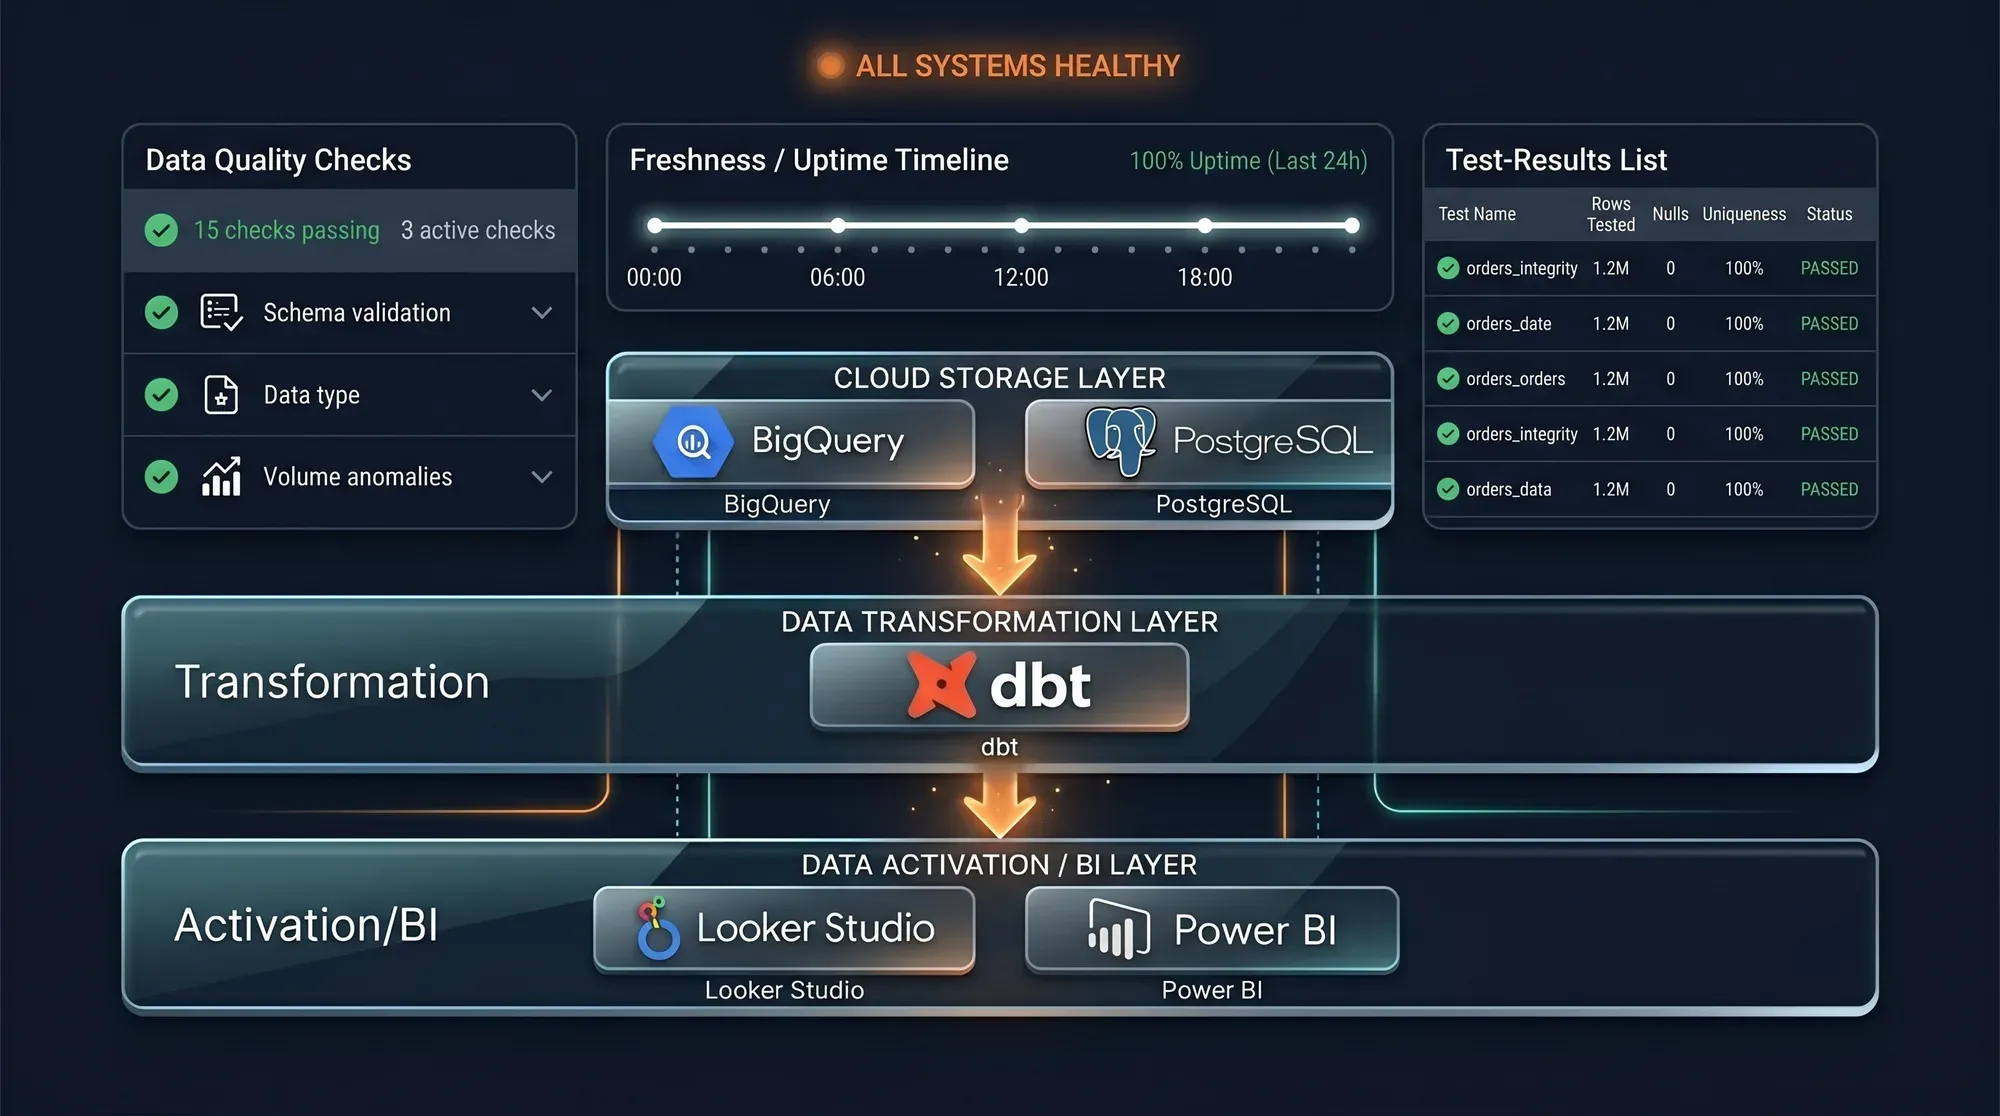
Monitoring & Handover
3–5 daysElementary or Great Expectations for data quality alerts. dbt docs deployed as your team's data dictionary. Incremental load configuration to keep costs predictable. Incident-response runbook and a technical handover session.
What's included
Warehouse Provisioned & Tuned
BigQuery project (or Postgres instance), IAM configured, partitioning + clustering applied, cost monitoring and budget alerts in place from day one.
10–15 Sources Connected
GA4 native export, CRM (Salesforce / HubSpot / Zoho), ad platforms (Google / Meta / TikTok / LinkedIn), e-commerce (Shopify / Magento), ESP (Klaviyo / Brevo), payments (Stripe). Every connector monitored.
40–60 dbt Models Versioned
Staging, intermediate, and mart layers — each model in git, peer-reviewed, tested for data quality. dbt docs auto-deployed as your team's queryable data dictionary.
3–5 Executive Dashboards
Built in Power BI or Looker Studio on the mart layer. Revenue / CAC / retention / RFM out of the box. Auto-refreshed. Each dashboard documented and team-trained.
Incremental Load Configuration
Nightly jobs process only new and late-arriving data, not full table scans. Your BigQuery bill stays predictable even as event volumes grow 10×.
Segmentation Marts (RFM + Custom)
For e-commerce: RFM segments updated daily, cohort retention curves, LTV / CAC payback period by channel. For B2B / agency: custom scoring models tied to your business logic.
Who this is for
E-commerce Brand
You run paid acquisition across 4+ channels, have a Shopify or Magento backend, and a CRM that nobody trusts. We unify everything into a warehouse so you can finally answer the questions that compound revenue:
- RFM segmentation — which 20% of customers drove 80% of LTV last year?
- Cohort retention — does the February cohort buy again in May? How does that compare to August?
- LTV / CAC payback period by channel — how long until Meta pays back vs Google Ads vs email?
- True multi-touch attribution — your own model on stitched journeys, not GA4's heuristics
Digital Agency
You run reporting for 8–15 client accounts. Every Monday is a fire drill of CSV exports, Looker copies, and dashboards that don't quite match each other. We build a white-label data infrastructure that:
- Consolidates every client's GA4 / ads / CRM / Shopify into a multi-tenant warehouse
- Auto-refreshes branded dashboards per client — logo, colors, KPIs configured once
- Surfaces YOUR margins per account so you know which clients are profitable
- Cuts QBR prep from 2 days to 2 hours
What to expect
0d → 30s
Reporting cycle time
0+ → 1
Sources of truth
0+
Months of queryable history
Case Studies
Case study coming soon
Case study coming soon
Frequently Asked Questions
Ready to See Your Data In One Place?
Get a free Data Engineering audit. We'll map your current sources, identify the gaps, and show you what a unified warehouse would look like for your team.